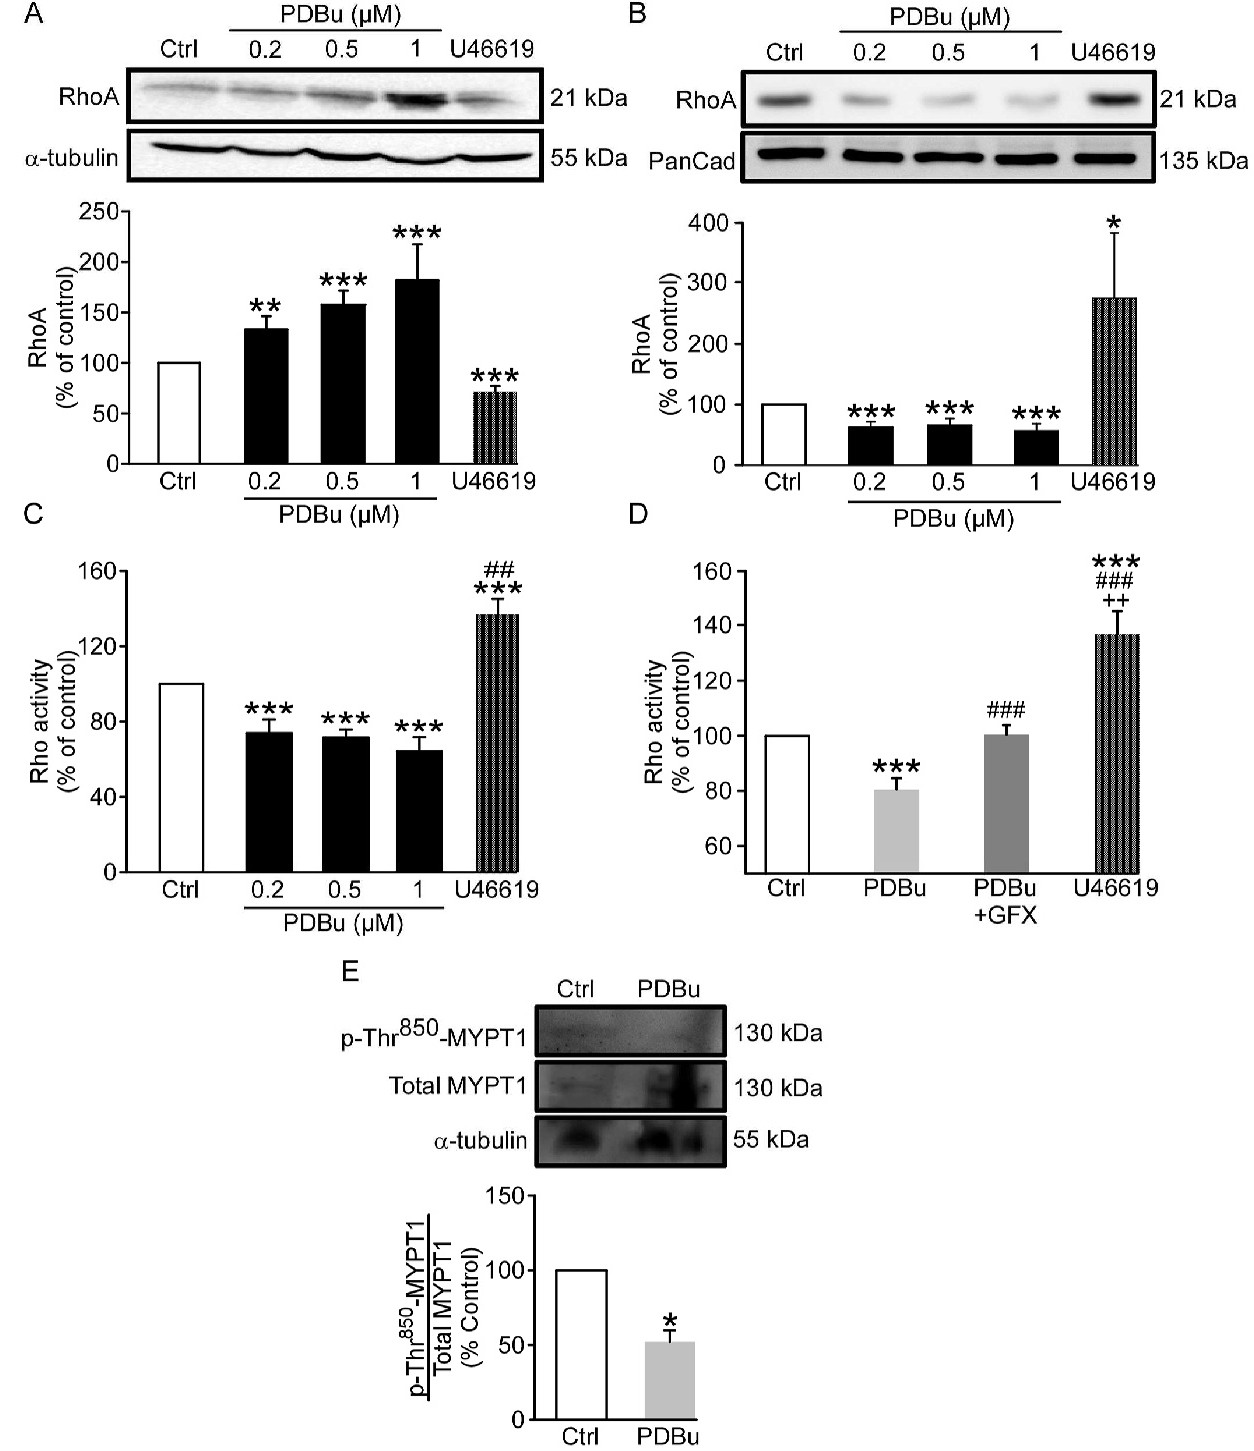
Fig. 7. Analysis of the role of RhoA in PDBu-treated femoral arterial rings. Representative immunoblot and densitometric analysis showing RhoA levels in cytosolic fractions (A) or membrane (B) obtained from arteries exposed to PDBu. (n = 10). *P < 0.5, **P<0.01, ***P<0.005 vs. control. (C) RhoA activity measured at 10 min in PDBu (n = 5). ***P<0.005 vs. control, ##P<0.01 vs. PDBu. (D) RhoA activity in arterial segments incubated in different conditions. GFX (0.5 µM) was applied 30 min before PDBu. PDBu (0.2 μM) and U46619 (1 μM) were applied for 10 min (n = 7). Statistical significance was calculated by one-way ANOVA or Kruskal-Wallis test followed by either Student-Newman-Keuls t-test, Tukey, or MannWhitney U test, where appropriate. ***P<0.005 vs. control, ###P<0.005 vs. PDBu, ++P<0.01 vs. PDBu + GFX. (E) Immunoblot shows p-Thr850-MYPT1 and total MYPT1 from arteries treated with vehicle (ctrl) and PDBu (0.2 µM) (top). Densitometric analysis of data was normalized to control (bottom). Comparison between treatments from the same animals was assessed by Friedman test followed by either Wilcoxon signed-rank test (n = 6). *P<0.05.